
HNFSC: nutrition part i
you are the macros you eat, emissions and all

“Don’t dig your own grave with a knife and spoon”
Welcome back to my series on the Hierarchy of Needs for Food System Change! If you missed the intro to what this is all about and why I’m writing about it, check out this page.
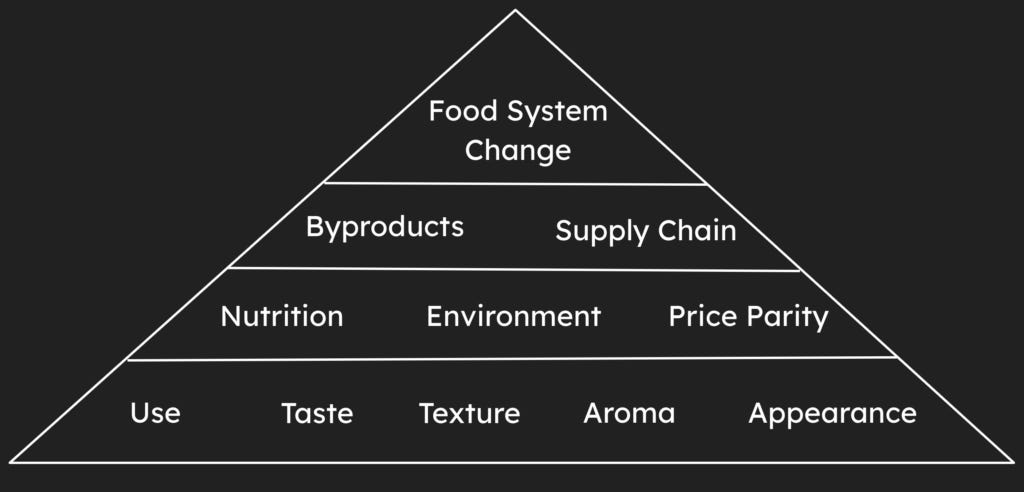
Today we move from the elements Tier 1: Bare Necessities for resilient food system change: taste, aroma, use, appearance, and texture, and climb up the pyramid to Tier 2: Human Impact!
Nutrition is what supports us in building muscles, gaining weight and feeling like our mind is firing on all cylinders. It’s a massive landscape that we’re going to break up into two mini blocks about macronutrients and micronutrients. I’m not going to talk about the importance of moving your body in conjunction with what you eat, nor am I going to praise a diet here. Eating comes in many different forms and I’m not here to promote the newest fad that will get you shredded, but I do want to touch on how producing food with the building block of nutrition contributes to a healthier environment and population. How you get these macronutrients has an impact on the sustainability of our food system and we all have decisions to make when we pick up our spoons.
So what are the pillars of macronutrients, you ask? We’re talking about the big three: fat, carbs, and protein. Each one has been praised and demonized throughout the dieting ages, but the fact is that all people need to eat, and these three represent how each of us stay healthy, cognizant and mobile.
fat: the greasy one

Fat, oil, and grease all fall into this building block. It is the most energy dense of the three building blocks and is normally one of the groups that give foods texture like a fatty cut of beef or a mayonnaise. They’re omnipresent for this reason because they can make potato chips more satisfying than the drier oven-baked varieties, or make a dry chicken sandwich sing with a dollop of Hellman’s. While fat can come from a variety of places, they generally all have 9 kcal/g of oil, so caloric density is fixed on these guys.
Fat sources can be from animals like butter, beef tallow, pig lard, sheep lanolin (probably don’t cook with this one…), and schmaltz, where plant-based sources can be olive oil, coconut oil or rapeseed oil…err…canola oil. Hell, there’s even oil from algae, yeast, and more!

While they all might be fats, I’m sure you’ve noticed that most of these have different cooking properties and flavors. The flavors came from the other aromatic and taste compounds that we’ve chatted about in the past, while cooking properties, like max cooking temperature and smoke point are a function of the individual types of fatty acid molecules that make it up, like stearic acid, oleic acid, and linoleic acid. Not to dive too deep into chemistry, but each one of these molecules have a different melting point and combustion point, which leads each fat to have different cooking properties and uses. Some are hard at room temperature, which makes them good for chocolate, let’s say, and others are liquid, and better for aioli. Their uses are a function of these properties and we can modify olive oil to be solid, like in an oleogel. In this way, we can make unsaturated fats (the liquid ones) act like saturated fats (the solid ones) and can make them fit the dish or product we want!
It’s important to consider the source of the fat when we then look at nutrition and our food system sustainability. Since all fats have the same calorie tab at 9 kcal per gram, we can hone in on the source and its emissions.
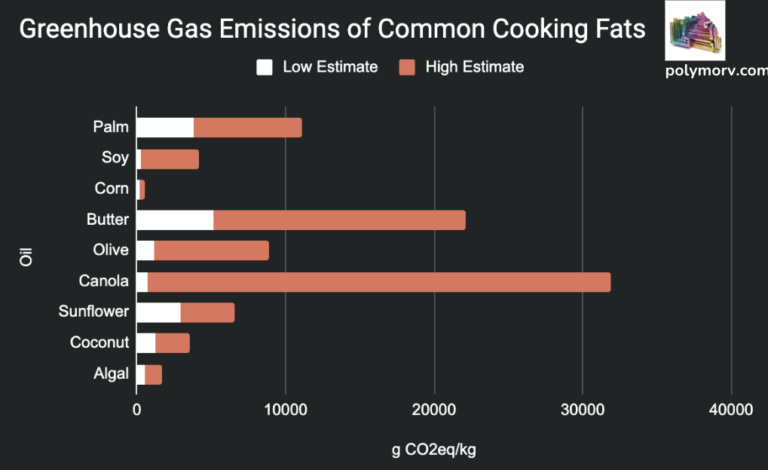
We can see the grams of carbon dioxide equivalents per kilogram of oil produced from some common cooking oils above. Butter has a wide range of greenhouse gas (GHG) emissions as the sole animal fat, and canola and palm have some of the widest ranges for the plant-derived sources. These ranges come from the use of no-till farming practices or large amounts of fertilizer use and larger transportation costs as well. I’ll write more on these concepts in the future as we learn more about GHG emissions as they pertain to farming practices. I want to highlight here that we should be looking more at our vendors and how we’re producing these succulent, juicy foods, or how we’re coating our broccoli to bake for dinner.
Fat is important for the future of our food system, but determining the right fat for the right use and how it impacts our global system is something we all have control of. I’m particularly excited about the future of algal and yeast-derived oils as these innovations scale-up for commercial use, given its promising carbon footprint. Again, more liquid, plant-derived fats can have a more texturally dynamic range since we can also make them act similarly to butter. Margarine may not be the answer, but we need to be more creative in how we use lower impact fats for the future of our food supply.
carbohydrates: chewy, crispy and more

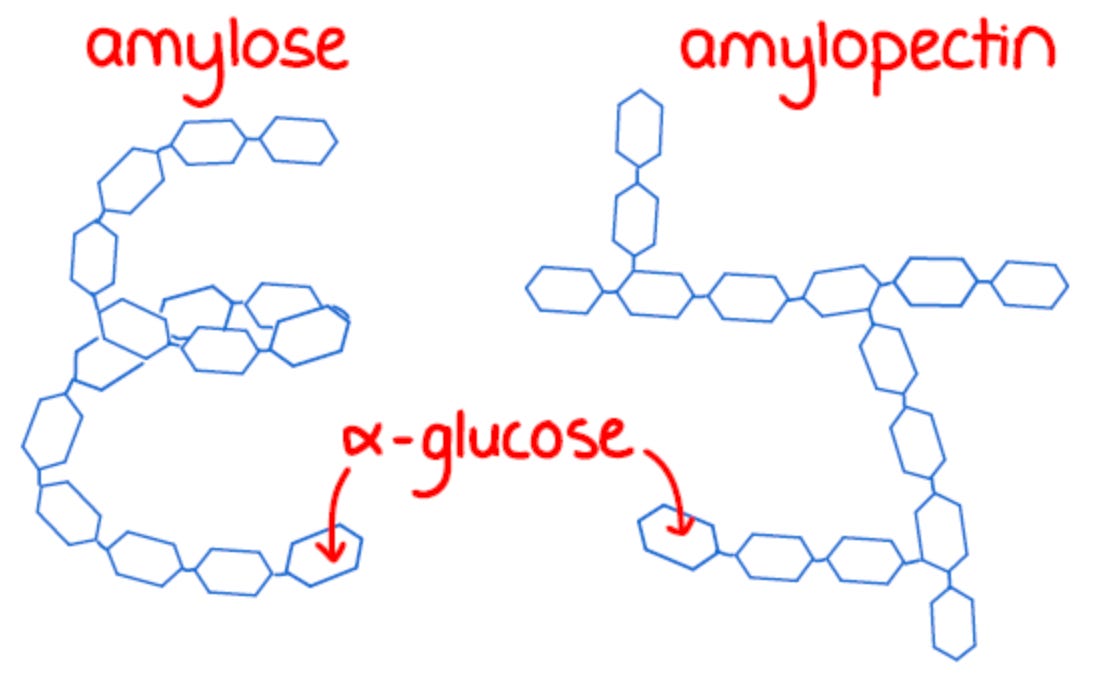
Ahhh, carbohydrates. Such a lovely macronutrient – one of my favorites. Carbohydrates are diverse and at their most simple level they are sugars, like glucose and fructose. As we build up these chains we start to get starches and fibers that have different properties depending on the way they are chemically arranged. To heavily oversimplify, starches come in a mixture of linear forms (amylose) and branched forms (amylopectin), where fibers are linear or branched starches, but in a bonding formation that doesn’t allow your body to break them down. When you eat a piece of bread, you’re eating these branched and linear starches that are then broken down to sugar and absorbed.
I want to focus mainly on starches and sugars for how to think about nutrition and sustainability of products. Since each starch source can have a mixture of these different linear and branched forms, they will have slightly different caloric density, whereas sugar has the same caloric density no matter the source at 4 kcal per gram. In the same way that fats have certain GHG emissions due to their yield, fertilizer intensity and tilling practices, so do carbohydrates.
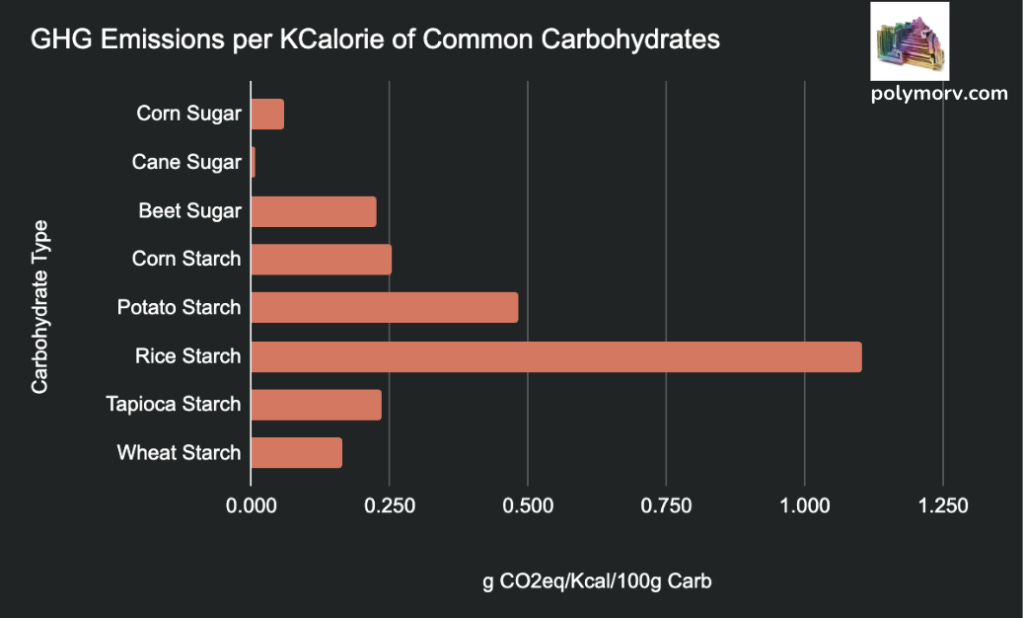
This chart shows the amount of GHG emissions per calorie of 100 grams of a given carbohydrate source, so we can normalize the starch nutrition with its environmental impact. What struck me when putting this together was how efficient cane sugar is and how wildly inefficient rice and potato starch are when we look at these data. Cane sugar isn’t perfect by any stretch of imagination, with habitat and biodiversity loss, as well as fertilizer runoff and more. These same issues are present with all of these products, but it does go to show how much this is still offset by the efficiency of the plant.
On the other end of the spectrum, rice is very difficult for Planet Earth to scale up. There is a massive amount of water usage for rice paddies and the water is a breeding ground for methane-producing microbes. Large quantities of fertilizer are also used, and rice plants aren’t able to take in as much as used, so there is more runoff into water sources and wasted use.
Each starch has different texture profiles, whether pão de queijo made from tapioca, or mochi from rice starch. The creativity lies in how to use mixtures of these starches both for awesome texture experiences, and also to limit the environmental impact each of these delicious foods have. Maybe looking at a mochi with corn or wheat starch blended with rice starch is just as good, but doesn’t have as much GHG emissions to boot.
protein: the muscle
Protein has been getting juiced in recent years, with everyone from your mom to your favorite influencer touting eating it in bite. The FDA recommends getting at least 50 grams of protein a day, but after reading Burn by Herman Pontzer, I found out that this is just to recoup the amount your body discards each day. If you want to get stronger and help your body recover from strenuous exercise, you flat out need more.

With the rise of alternative proteins in the last decade, there is also more need to recognize some key facts about protein, namely protein quality and quantity. Quantity is pretty simple: how much protein does it say on the label? Protein quality is a bit more complicated and requires a protein digestibility-corrected amino acid score, PDCAAS (pee-dee-cas). This is a score based on how bioavailable the protein is when digesting it, as well as whether the nine essential amino acids are in the correct proportion necessary for your body to use. It’s typically expressed as a percentage and is multiplied by the quantity to give you the actual amount of protein in your food. You can generally tell how much complete protein you’re getting based on dividing the amount of protein on an nutrition facts panel by 50 and comparing that to the percent of your daily value. Let’s try it out quickly below:
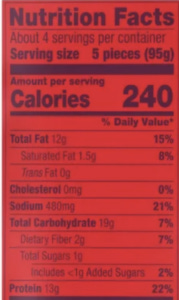
Here we have IMPOSSIBLE brand chicken nuggets with 13g of protein. So we would do 13g protein / 50g daily value protein = 26%. We can then see on the label that is lower at 22% daily value. So even though there are 13 grams of protein, you’re really getting 11 grams of complete protein. Many times, folks won’t even put the percent of your daily value on the label, so you’ll just have to estimate based on tables for the ingredients that are in the product. You can mix and match proteins to get to complete proteins, which is why cultural staples like beans and rice have stuck around. Beans make up for the lack of lysine in rice, while rice makes up for the lack of methionine in beans!
Now, let’s look at how different protein sources look under the sustainability microscope:
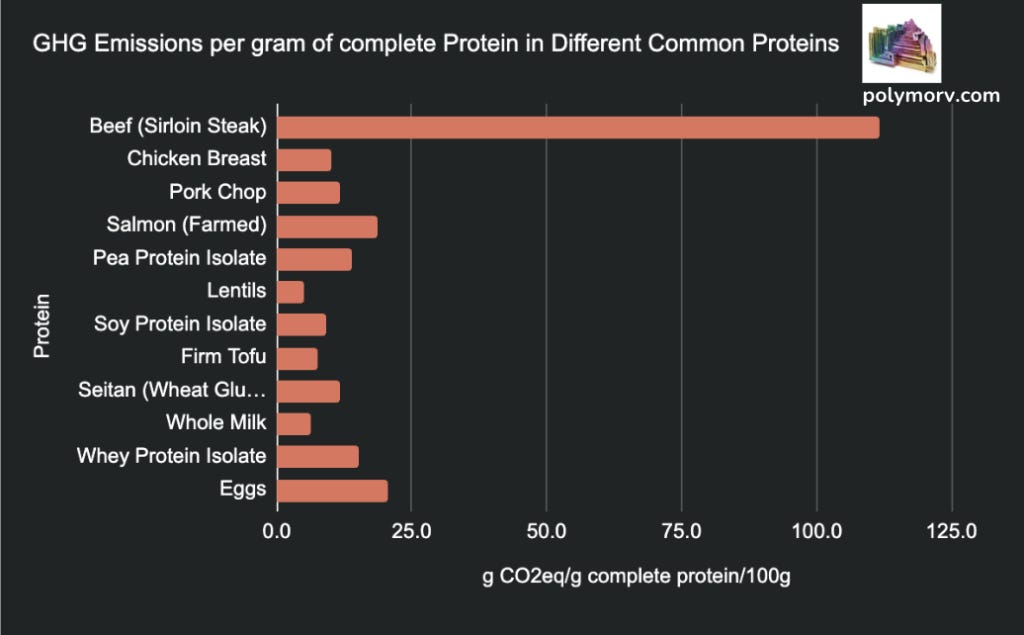
These data are looking at how much GHG emissions are produced when making these foods. They’re normalized with the amount of complete protein per 100 gram serving of each. This way we’re taking into account low PDCAAS of pea protein isolate (54%) with something like whole milk (100%), so pea protein isolate gram for gram would actually be more efficient if its protein were more digestible. Also every protein is 4 kcal per gram as well, so they’re already normalized for caloric density.
What’s wild is that beef has 10x the GHG emissions of every other animal protein! There are countless news articles talking about the inefficiency of beef production, and sure it has a highly digestible protein, but you can eat 5 times more chicken breast and it’s still more sustainable than beef. The reason lentils are lower is because these are just cooked lentils and don’t require the high amount of water and energy needed to just isolate the protein like in soy protein isolate, so this emission would go up for more processing. I told you I’m not going to tell you how to eat, and I still enjoy a steak from time to time, but even as I put this together I was pretty shocked to see how much the source of protein impacts GHG emissions.
Protein is truly a powerhouse for growing muscles, building hormones and enzymes, and can’t be overlooked. The protein quality lacking of plant proteins generally needs to be taken into account when you do Meatless Mondays. We all can do our part to make sure that we learn how to mix and match all of these sources to get the protein we need each day, but aren’t hammering the atmosphere with emissions.
so, where do we go from here?
As we’ve talked about in the Tier 1 of our Hierarchy of Needs, getting someone to like your dish or product is tough. The balancing act begins when we start to make sure that someone likes your product and it has a net positive impact on our food system. Nutrition is ultimately important for humans in how it impacts how our bodies grow and develop, but if it impacts our drinking water and atmosphere it can still be negative overall. We’ll dig into these data in future posts because we’ll want to understand how different types of regenerative and sustainable farming practices affect sustainability as well.
This is just the tip of the iceberg of a entire new series of posts, so be sure to subscribe below to keep up on them!